OnePlanX Product

MTA Chart Workspace

Build clear milestone trend analyses in minutes. Track date movement across reporting periods, generate management-ready status reports, and share results securely with your team.

  • 5+ Milestones tracked per chart
  • 1 click export for chart and report
  • Read-only links for stakeholder sharing

What Is an MTA Chart?

A Milestone Trend Analysis (MTA) chart visualizes how forecast milestone dates move over time. Each reporting period captures the expected completion date for every milestone, making schedule drift transparent at a glance.

Typical Use Cases

  • Program and project steering meetings with recurring schedule reviews
  • PMO governance for early detection of delays and trend escalation
  • Management and stakeholder communication with concise, factual schedule evidence

Why It Is Useful

  • Shows whether planning reliability is improving or deteriorating over time
  • Separates one-off noise from persistent delay patterns
  • Supports faster decisions with clear baseline-vs-current movement

MTA Chart App Features

The MTA Chart app turns this method into an operational workflow: from period data entry and milestone control to reporting, styling, sharing, and export.

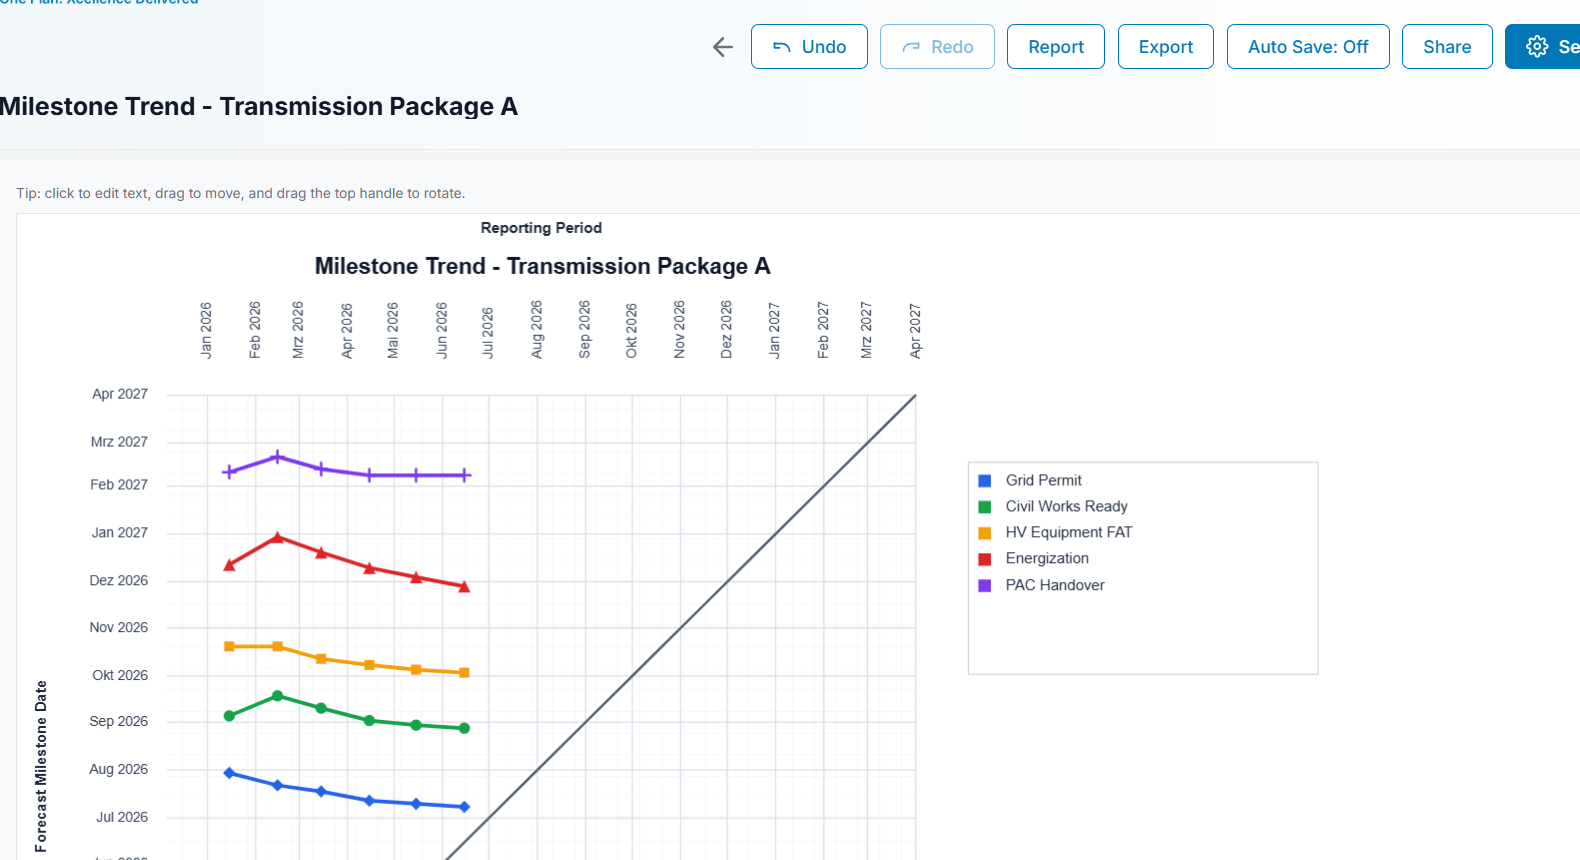
MTA chart editor workspace overview

Core Workspace

Interactive Milestone Trend Editor

  • Multi-milestone trend lines with clear visual differentiation
  • Inline adjustments for periods, milestones, scales, and chart styling
  • Advanced control over axis labels, markers, legend, and label editor
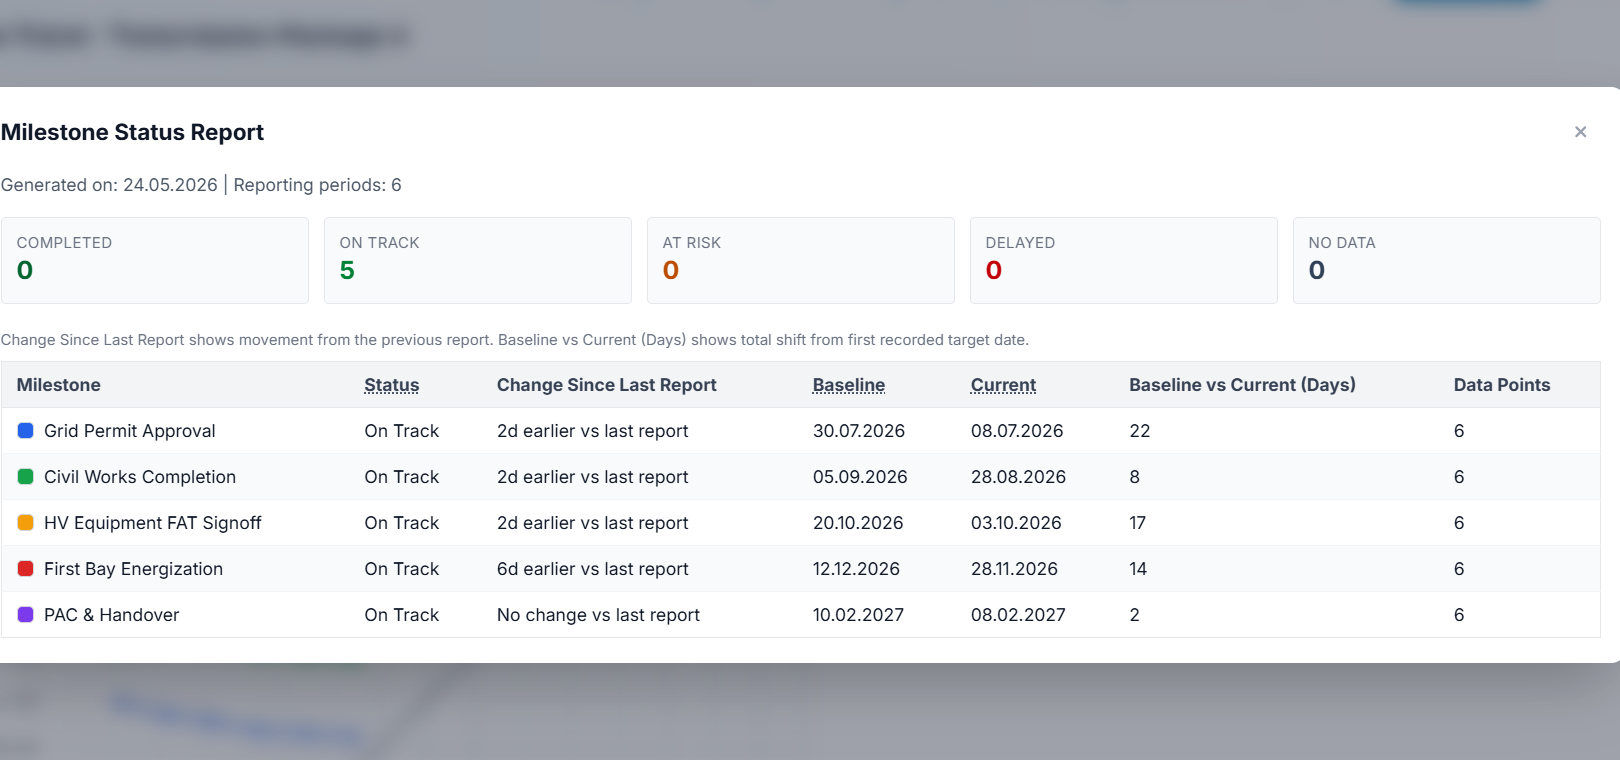
MTA chart status reporting modal

Reporting Intelligence

Structured Milestone Status Reporting

  • Snapshot-level status overview by completed, on-track, at-risk, delayed
  • Baseline vs current comparison for fast schedule variance review
  • Management-facing table output designed for decision cycles
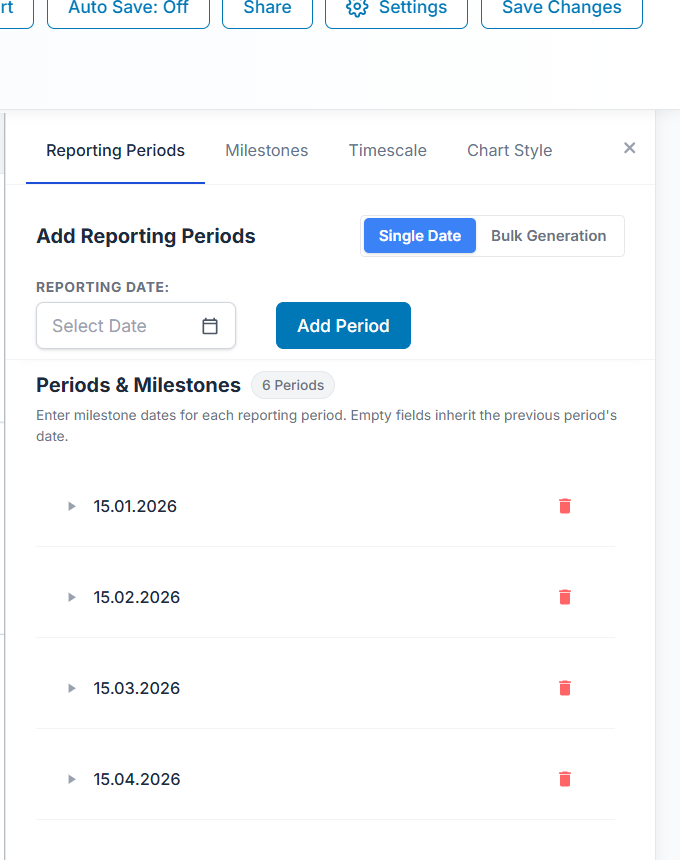
MTA chart reporting periods settings panel

Data Entry

Reporting Periods and Milestone Date Control

  • Single-date and bulk period generation in one workflow
  • Period-level milestone value management with quick inline updates
  • Stable period sequencing for repeatable monthly reporting cycles
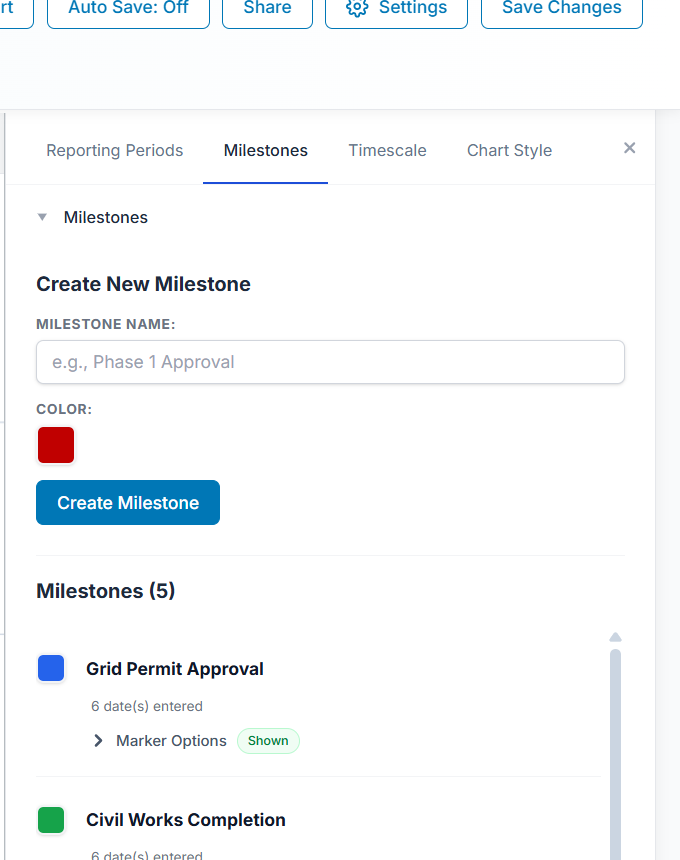
MTA chart milestone settings panel

Customization

Milestone Definition and Visual Control

  • Create milestones with dedicated color assignments for clarity
  • Per-milestone configuration keeps large datasets manageable
  • Works seamlessly with chart style controls and legend behavior
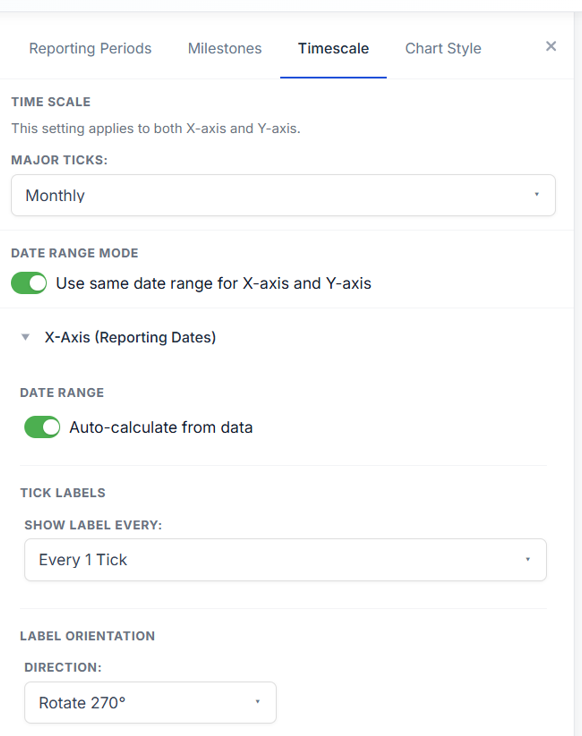
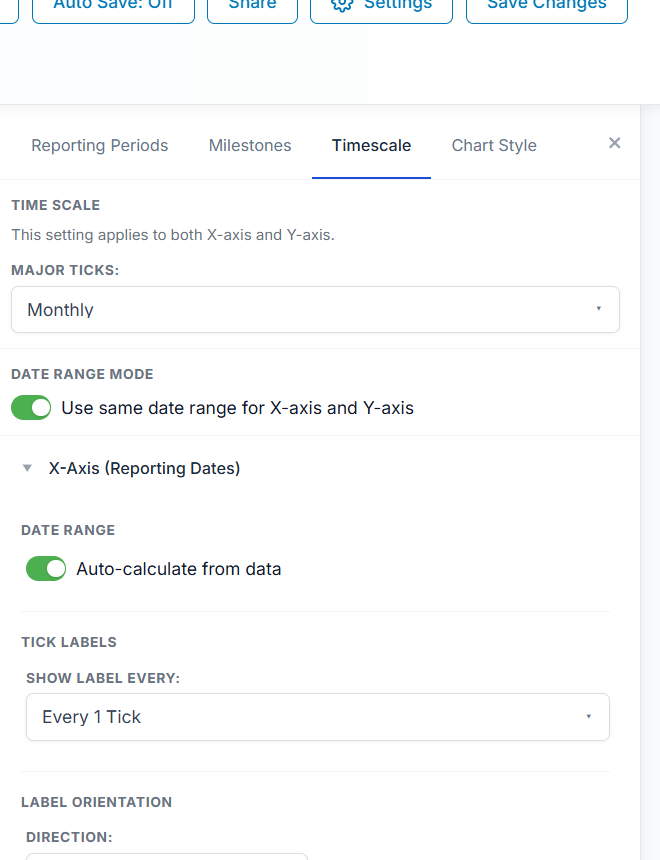
MTA chart timescale settings panel

Governance

Timescale and Axis Standardization

  • Central control over date range mode, major ticks, and label cadence
  • Consistent chart interpretation across projects and review boards
  • Supports executive-ready visuals with repeatable formatting rules
MTA chart style settings panel

Design System

Enterprise Branding and Chart Styling

  • Unified styling controls for page, chart, text, axes, labels, and legend
  • Consistent visual identity across program and portfolio charts
  • Professional formatting suitable for external-facing reporting packs
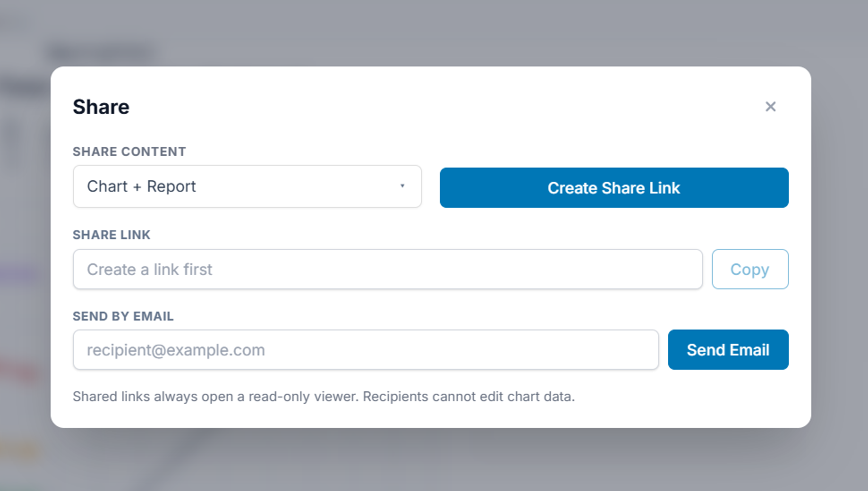
MTA chart share modal

Distribution

Secure Sharing and Export

  • Create read-only share links for stakeholders and leadership teams
  • Send results by email without exposing edit controls
  • Export module supports chart-only, report-only, or combined outputs